When testing and debugging your site, it's good to have information about what exists on…
I got another quality debugging plugin for you developers out there, and a good companion to something like Debug Bar or Helpful Information. Query Monitor gives you in-depth access to the queries made on your page, as well as a little information about your server and database configuration.
What’s It Do?
Like some other plugins out there, Query Monitor sits in your admin bar and gives you access to information about what is being queried on the page you are on. It goes really into depth about each and every database query on the page and allows you to track down what plugin is causing it, which are causing your page to slow down, and how many of each database call is being made. It also has information that relates to any API hooks being used on your install as well as additional information about HTTP requests, AJAX requests, and PHP errors.
Query Monitor is useful for tracking down when you are being wasteful with your queries and figuring out what plugins might be slowing down performance.
How’s It Work?
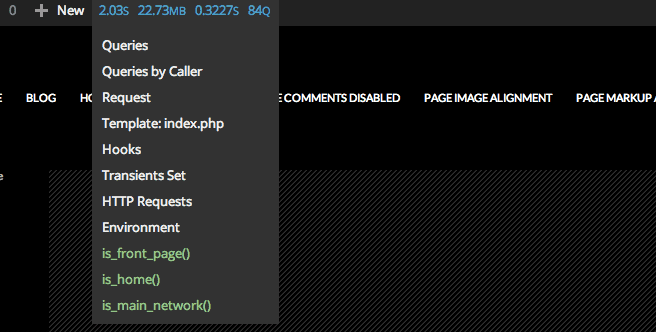
After you install and activate the plugin, you will see a new option in your admin bar on any page on your site, either on the back-end or front-end. Query Monitor appears in your admin bar as a list of information related to the queries on your site. You will see the time it takes the page to load, how large your page is, your database query time, and the number of queries on your page. If you click on this link, you will be brought to the footer of your page, where Query Monitor’s information is. You can also select any of the individual sections from the drop-down menu.

Select from a list of options in your admin bar
First, you will see information about your queries generally. First, you will see a list of every query made on your page. For each, there will be listed the exact query, what is being called, what part of your site is calling it (plugin, core, etc.), and the time it took to load it. Slow queries will be grouped together. If you notice that any slow queries are being called, it is worth taking a second look to see if you can tweak it, or remove a plugin it might be coming from.

General information about each and every query
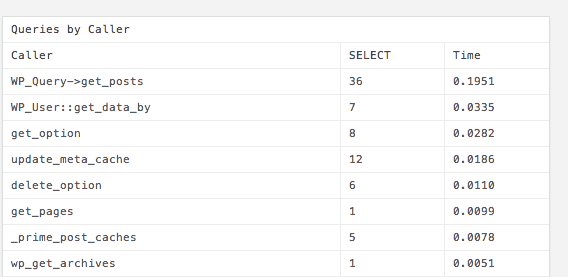
Next, you’ll see your queries listed out by their called object and by their component. So, in the “Caller” section you can see how many calls to “get_pages()” are on your page. In the “Component” section you can see how many queries are being made by core, by your theme, and by each individual plugin. This gives you a useful overview.

Queries are broken up by the caller
Below this is a list of API hooks that are being used on the page. For each hook, you will see where in the code it is located, what kind of hook it is, and what component of your site is using it. It could be useful for tracking down unexpected functionality.
Lastly, is a group of information about your site and it’s configuration. You can see information about your PHP set-up, MySQL config, theme information, and query variables being used. HTTP requests made on the page can be seen too, as well as any errors associated with them. This is also where AJAX requests will be located. Think of this section as a birds-eye view of your page from a troubleshooting perspective.
In the drop-down menu, you will also see information about conditionals that apply to the current page and which theme file is being used, which can be very helpful in theme development.
Query Monitor is really about tracking the performance of your site, so use it appropriately and try and cut out what you don’t need.
Costs, Caveats, Etc.
Query Monitor is free and updated frequently. If you are having a problem with the plugin, the developer is very active on the support forums. Its code base is listed on GitHub. If you find a bug or are having a problem with it, it’s probably best to list it in the repo’s issues section.


