Keeping track of Google Analytics usually means switching back and forth between your Google Analytics…
Google Analytics is more or less the gold standard when it comes to site analytics. But it means handing your data over to Google, which may make you uncomfortable for a number of reasons. WP Slimstat offers a great alternative by providing you access to analytics for your entire site, hosted on your own server, and available from the WordPress dashboard.
What’s It Do?
WP Slimstat drops a small bit of Javascript into your site or uses a server-side script in order to track your audience, content and user flow. Its dashboard is similar to what you might find in a third party service, like Google Analytics, but it hosts all of your data within your WordPress database without taking up too much space.
You can access the Slimstat dashboard from your WordPress admin, and get information on page views, visitors, traffic sources, referrals, geolocation, bounce rates, and just about everything you might expect from your analytics. Slimstat also has a few WordPress specific analytics built in and tracks top tags, categories, and recent queries. It gives you plenty of options to customize it, and you can change the style and output of your analytics dashboard.
How’s It Work?
After you install and activate WP Slimstat, it will begin tracking your site right away. The best way to get started is to go to the newly created Slimstat menu, and click on Slimstat -> Settings. This has general settings for configuring the plugin.
There are a lot of Settings, and it’s worth looking through them, but I’ll just be going over the basics here. In the General tab, you can configure global settings, and turn on or off the plugin. One option to pay attention to is “Tracking Mode”. You can either use Javascript or a Server Side Script. The Javascript method works best if you have a cache plugin installed. It means an extra file loaded into your page, but it’s a tiny script and is a bit more reliable. Also pay attention to “Spy Mode” which enables the plugin to track screen sizes, outbound links and other browser specific data. The last option on this tab is “Retain data for:”. Slimstat stores historical data for a certain amount of time before deleting it. Specify this, in days, here. If you do use Slimstat and want to retain data, it’s best to backup your database within the timeframe and keeps it stored elsewhere, so your database doesn’t get too big.

Some general settings
The Views tab allows you to customize how your Dashboard is configured. You can leave these at their default at first. The Filters tab lets you keep an eye out and especially track certain users. You can turn tracking on or off for registered users, or blacklist (don’t track) specific usernames, IP addresses, or capabilities to separately track. You can also choose to blacklist specific pages, users coming from specific countries, User agents (browsers and devices) and Referring Sites. Unless you have a specific need for this section you can ignore this.
The Permissions tab allows you choose who can access Analytics and Slimstat Settings by capability, or by allowing specific users access. Each one has its own section, so they can be different. The Advanced tab has several miscellaneous options for customizing functionality. You can, for instance, track outbound links or add custom CSS to the dashboard view to customize it yourself. To do so, WP Slimstat offers these CSS selectors for your use:
[id^=slim_] .header.is-search-engine, .is-search-engine{ }
[id^=slim_] .header.is-direct, .is-direct{ }
[id^=slim_] .header.is-known-user,.is-known-user{ }
[id^=slim_] .header.is-known-visitor,.is-known-visitor{ }
[id^=slim_] .header.is-spam,.is-spam{ }
Maintenance has a few options for developers if you’d like to test or debug the plugin.
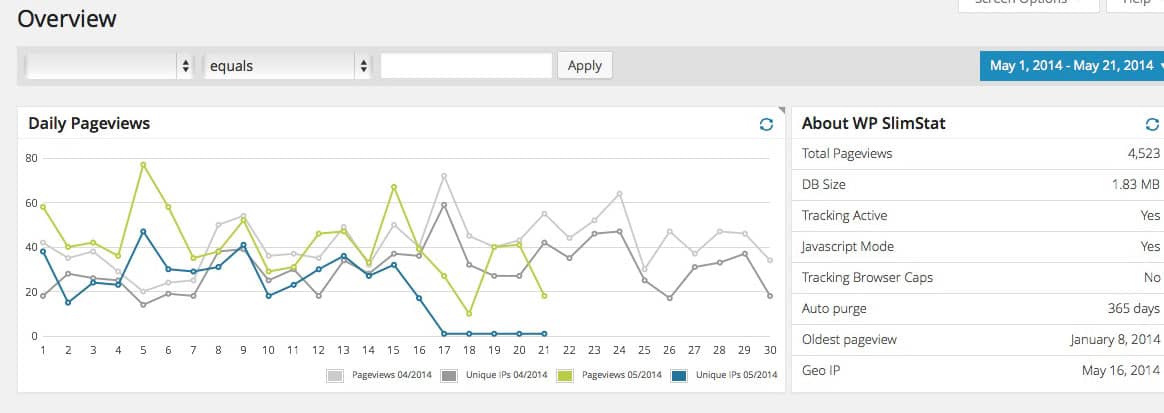
To actually view your analytics, you can use any of the menu options provided by Slimstat. If you visit Slimstat -> Overview, you’ll get a top-level view of your website’s traffic. First and foremost, you’ll be able to see your page views for each day on a graph, and a basic view of total page views in the last month, as well as who is currently online. Below this, you’ll see some more high-level information, like what screen sizes and browsers users are using, the top pages on your site, and a quick look at traffic sources.

Basic overview
For any of the dashboard analytics pages, you can easily drag and drop the different boxes around until you find an order that you like.
Slimstat -> Audience has some more specific information about visitors to your site. You can see your visitors, day by day, and see how many visitors are new and how many are returning. You’ll also see some stats about how users are navigating your site, including the browsers they are visiting from, the operating systems they are using, what country they are coming from, and how long users are spending on your site. These categories are all presented in a list, so you can sort and navigate however you want.
Next up, Slimstat -> Site Analysis contains detailed information about your general audience. It starts with a graph showing average pageviews, day by day, then lists out details about your WordPress install. This includes a list of total pages and posts, comments, pingbacks, trackbacks, and frequency of comment and post publishing. The next section has statistics specifically related to WordPress. For instance, you can browse your most popular search queries in a list. Or, you can take a look at the top tags, categories, and authors. You can also take a look at what pages users are leaving from (recent bounces), and which links users are clicking to leave your site. There is also a section here for “Recent Events”. By default, Slimstat tracks things like files that are downloaded, what links are clicked, and what outbound links are followed. However, you can create your own event simply by attaching a Javascript event handler to any existing event on your site. This is only for Javascript developers, but the handler looks like this:
SlimStat.ss_track(event, event_id, message)
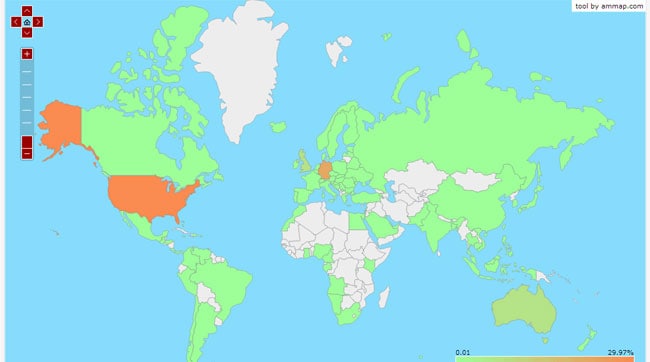
Slimstat -> Traffic Sources gives you detailed information about where your traffic is coming from, including search engines and the search terms that are bringing them, referrals from other sites and social media, and the countries users are visiting from. To get even more information about your user’s locations, you can go to Slimstat -> Map Overlay where you will see a full world map, and a breakdown of how many visitors are coming from different locations, by density. Countries with a lot of users will be highlighted in orange, fewer users in green.

Full world map
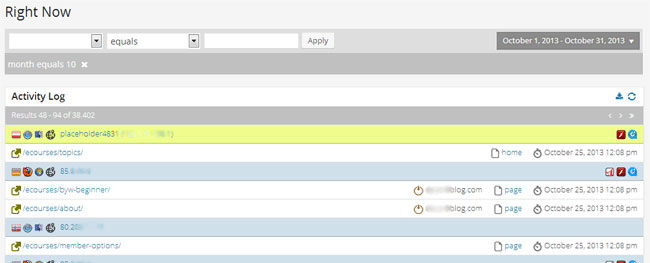
Lastly, Slimstat -> Real Time Log gives you some information about who is currently on your site. It is not overly detailed, but it will list the IP address of each visiting user, what page they are on, and some general information about their browser and operating system, so you can see your users interact with your site in real time.

A real time log
The best way to get started with Slimstat is simply to install it and try it out. You can install it next to an existing third party service for supplemental analytics, or all its own, the choice is up to you.
Costs, Caveats, Etc.
WP Slimstat is completely free and offers a lot of features. If you’re looking for more, the developers have a few add-ons available for purchase, which allows you do things like store your analytics data on a separate database, export your data to Excel, use the plugin with Multisite, and get more information on your users.
If you are having problems with the plugin, you can visit the dedicated forums, or open a new support ticket to get help straight from the developers.


