
If you're a WordPress developer, chances are from time to time; you just want a…
From the ones that make you want to eat them, to the simple and structured lines, charts and graphs are unavoidable if you are trying to explain complex information in an easy-to-understand way. Your customers want to know the data, and you want to show it to them. There is no questioning it, you simply have to have graphs on your website.
Adding these graphs, though, is another story. It takes a lot of know-how, and even if you have that, sometimes the end result does not turn out to be as eye-pleasing as you would have wanted it to be. The data you are trying to present should be explained in a comprehensive manner, and badly presented information makes it even more confusing.
If you are using WordPress Charts which enables you to add the graphs to your website in an easy and convenient way, ugly and confusing graphs become part of the embarrassing past you could effortlessly push out of your memory.Click to tweet
What is WordPress Charts?
WordPress Charts is a WordPress plugin which allows you to create amazing HTML5 graphs and charts on your WordPress website.
Features of WordPress Charts
There are several features of WordPress Charts that make it the right solution for your chart and graph problems.
- There are 6 chart types available – You can pick from line, bar, pie, radar, polar area, and doughnut types. Simply select the one that fits the data that you would like to present best, and show it to your customers on your website
- Dependency free – No need to worry about this .js plugin, as it is fully dependency-free
- Lightweight – When minified and zipped, it is only 4.5kb big, and it will not take too much space
- Customization – This plugin offers a bunch of customization options for your graphs
- IE support – The WordPress plugin provides additional support for older IE, namely IE 7 and 8
- Additional features to come – An important feature you should stay tuned for is the addition of the Chart Key tables, for example. These keys could be an immense help in explaining the information presented on the chart or graph to your readers
Additionally, the creators are planning on improving user experience by adding editor admin pop-up, which will enable effortless editing of the charts and graphs even for non-tech users.
How does it work?
Installing this plugin for your website is fairly easy. All you should do is search for this plugin in the plugin section and install it.
You can also get this plugin by uploading the wp_charts folder to the /wp-content/plugins/ directory. After doing so, the next step is to activate it through the “Plugins” menu in the WordPress. From there, you can use shortcodes to create the charts and graphs you need.
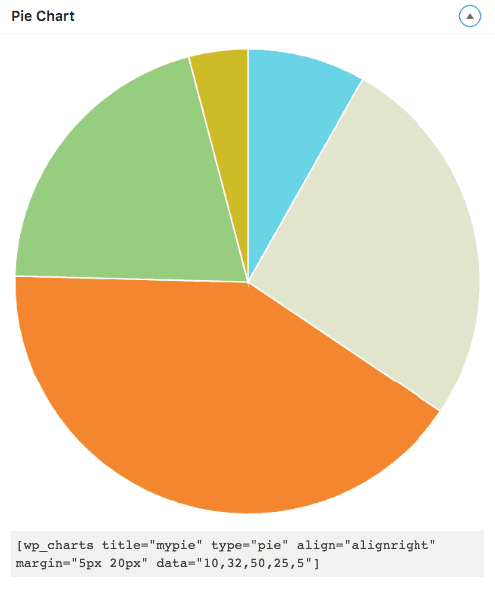
Everybody is familiar with the pie chart
To access all the shortcodes you would need for your graphs and charts, you should head out to Media option in your WordPress, and then into WP Charts.
Once you find the chart or graph that would present the information in the best possible way, all you should do is simply copy and paste the shortcodes to the text editor.
At this point, to make this work, there are several things worth remembering. Keep these in mind while adding your charts to prevent frustration and unnecessary stress.
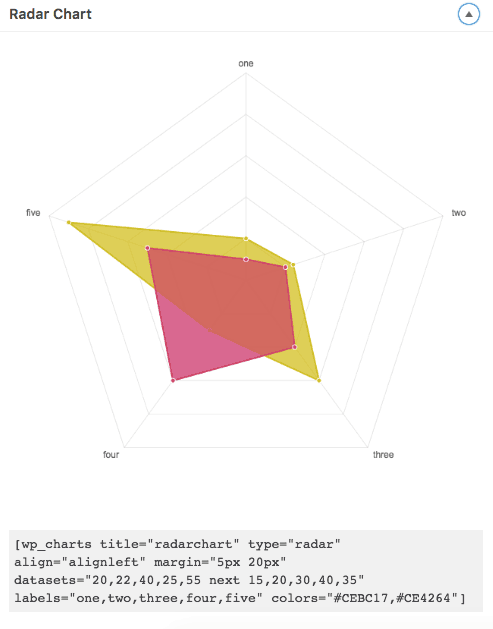
A little bit more complicated Radar Chart
First and the most important thing to remember is that every chart available to you requires a type, title, and data or datasets attributes. The latter depends on which graph or chart you are planning on using to present your information.
Pie, Doughnut and Polar Area are one-dimensional charts. These three require data shortcode attributes. On the other hand, the multidimensional ones such as Bar, Line or Radar, need you to use the datasets attributes.
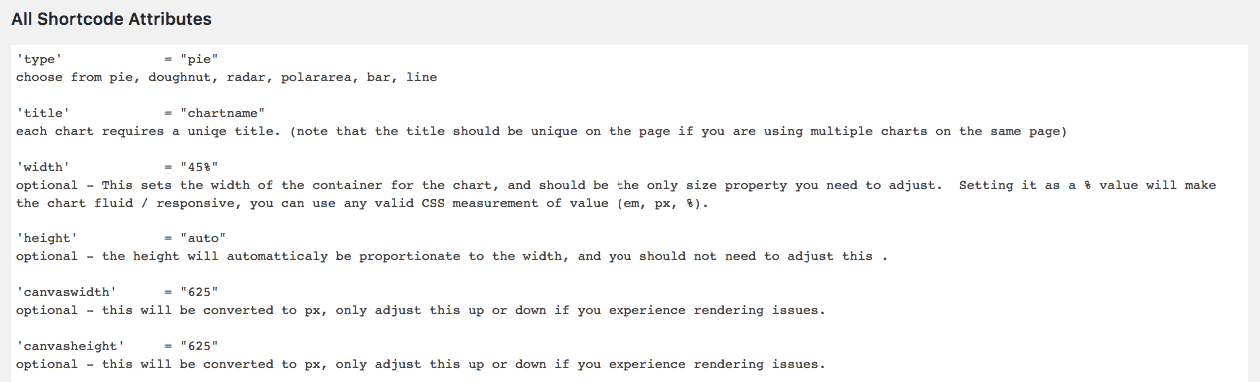
These attributes will help you create your charts the way you really wanted
When adding these, please keep in mind the way these are separated from one another. Feel free to revert back to the example of graphs you can find in the Media – WP Chart if you are feeling insecure about adding these.
Another way to add the graphs and charts to your website is by adding it in a form of a widget to your website. The way to do it is rather simple. You should head out to your Widgets under the Appearance menu. From there, simply add the WP Charts Widgets to your website.
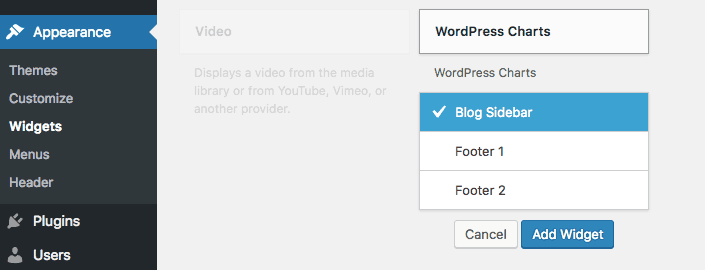
WP Charts settings
If you are feeling insecure about how to fill in the form that is required to have your Pie or Radar on your website, you can always head back to the shortcodes and check the example.
Costs, Caveats, Etc.
There are no costs for downloading this plug-in, it is completely free! No wonder it has already been installed over 10k times! Keep in mind that many new features are yet to come and that the team is working diligently on it.
While at the moment WordPress Charts only does the exactly what is supposed to do, the additional important and useful features will be added, and they will make this free app even better and simpler to use. If you’re looking for a more robust option to create charts in WordPress, you should use one of the best WordPress table plugins that offer that option.